Constant rate of change
Key Notes :
Definition:
- The constant rate of change refers to the rate at which one quantity changes in relation to another in a linear relationship. It is the same throughout the entire interval or period being measured.
- It is often described as the slope of a line on a graph.
Formula for Constant Rate of Change:
- The formula to calculate the constant rate of change (or slope) is:

- Where:
- Δy is the change in the dependent variable (vertical change).
- Δx is the change in the independent variable (horizontal change).
Learn with an example
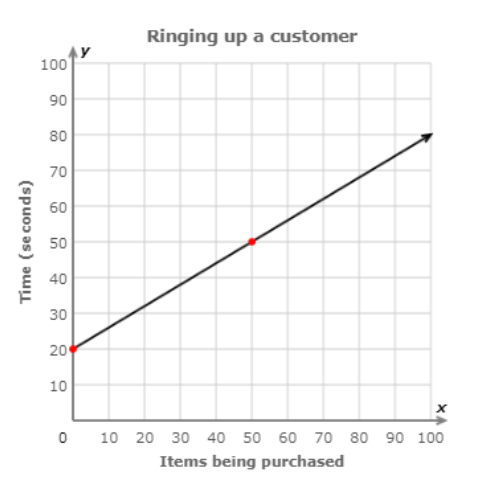
👉 This graph shows how the time required to ring up a customer is related to the number of items being purchased.

👉 What is the rate of change?
Write your answer as a decimal or integer.
_____ seconds per item
✈️ Find any two points on the line.

- Two points on the line are (0, 20) and (50, 50). Put those points into the slope formula.
- slope = change in y / change in x
- = 50 − 20 / 50 − 0 ——-> Plugin (0, 20) and (50, 50)
- = 30/50 ——-> Subtract
- = 3/5 ——> Simplify
- = 0.6 ——-> Write as a decimal
- The slope is 0.6. The rate of change is 0.60 seconds per item.
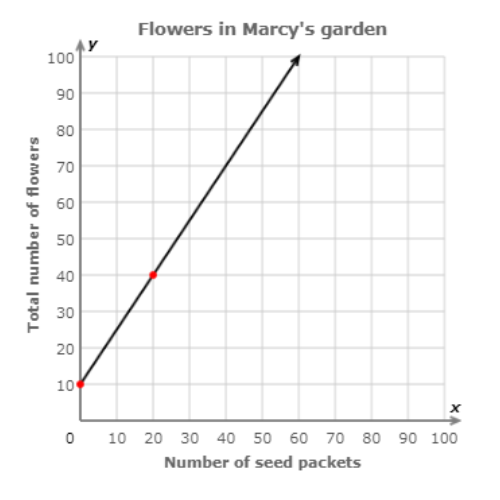
This graph shows how the number of flowers Marcy can have in her garden is related to the number of seed packets she purchases.

👉 What is the rate of change?
Write your answer as a decimal or integer.
_____ flowers per seed packet
✈️ Find any two points on the line.

- Two points on the line are (0, 10) and (20, 40). Put those points into the slope formula.
- slope = change in y / change in x
- = 40 − 10 / 20 − 0 ——-> Plugin (0, 10) and (20, 40)
- = 30/20 —–> Subtract
- = 3/2 ——> Simplify
- = 1.5 ——-> Write as a decimal
- The slope is 1.5. The rate of change is 1.50 flowers per seed packet.
👉 This graph shows how the number of pictures Gina has taken so far this year is related to the number of days she spends on holiday.

👉 What is the rate of change?
Write your answer as a decimal or integer.
_______ pictures per day
✈️ Find any two points on the line.

- Two points on the line are (0, 2) and (1, 4). Put those points into the slope formula.
- slope = change in y / change in x
- = 4 − 2 / 1 − 0 ——> Plugin (0, 2) and (1, 4)
- = 2/1 ——> Subtract
- = 2 —–> Simplify
- The slope is 2. The rate of change is 2 pictures per day.
Let’s practice! 🖊️

