Interpret charts to find mean, median, mode and range
key notes :
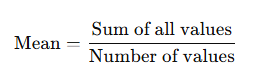
Mean (Average):
Formula:
Add all the numbers together.
Divide the total by how many numbers there are.
Median (Middle Value):
- Arrange the numbers in order (smallest to largest).
- If odd number of values, the middle one is the median.
- If even number of values, average the two middle numbers.
Mode (Most Frequent Value):
- The number that appears most often.
- A set may have one mode, more than one, or no mode.
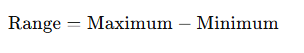
Range (Spread of Data):
- Difference between the highest and lowest numbers.
Formula:
📈 Interpreting Charts or Tables
- Charts may show data in the form of:
- Bar graphs
- Line graphs
- Frequency tables
- Pie charts
- Pictographs
✅ Steps to Follow:
- Extract the data from the chart or table clearly.
- List the values you need to work with.
- Organize the data in order if needed (for median).
- Apply the formulas to calculate mean, median, mode, and range.
🔍 Example: Frequency Table
| Score | Frequency |
|---|---|
| 2 | 1 |
| 4 | 2 |
| 6 | 3 |
| 8 | 2 |
Step 1: Expand the data
- 2 → 1 time
- 4 → 2 times → 4, 4
- 6 → 3 times → 6, 6, 6
- 8 → 2 times → 8, 8
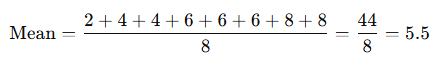
Data Set: 2, 4, 4, 6, 6, 6, 8, 8
Mean:
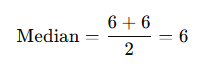
Median:
- Middle values: 6 and 6 →
Mode:
- 6 occurs most → Mode = 6
Range:
Learn with an example
People spun a wheel that had the numbers from 1 to 5 on it.
Spinning a wheel numbered 1 through 5
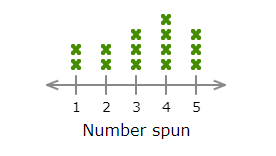
What is the range of the numbers?___________
Read the numbers from the line plot. Each X represents one number.
1 1 2 2 3 3 3 4 4 4 4 5 5 5
First, find the greatest number. The greatest number is 5.
Next, find the least number. The least number is 1.
Subtract the least number from the greatest number:
5 − 1 = 4
The range is 4.
To get credit for meeting his school’s community service requirement, Ron kept a volunteering log.
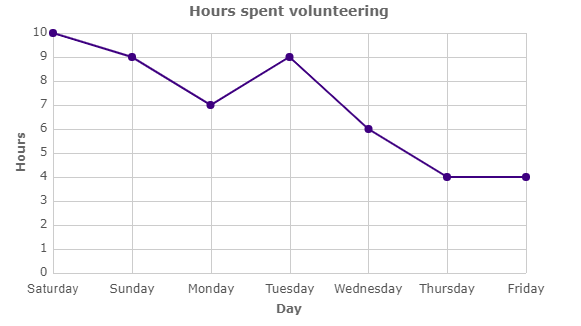
What is the mean of the numbers? __________
Read the numbers from the line graph. Read the line graph by finding the hours for each dot.
10 9 7 9 6 4 4
First, count how many numbers are in the group.
There are 7 numbers.
Now add all the numbers together:
10 + 9 + 7 + 9 + 6 + 4 + 4 = 49
Now divide the sum by the number of numbers:
49 ÷ 7 = 7
The mean is 7.
A pizza chef recalled how many pizzas she had made during the past 6 days.
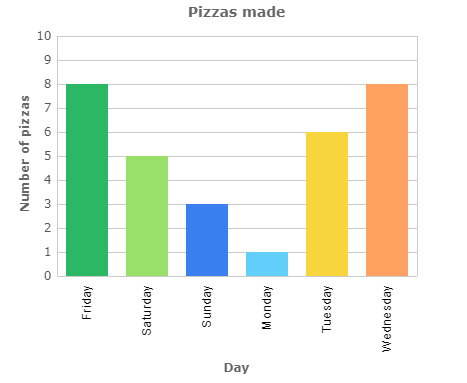
What is the range of the numbers?_____________
Read the numbers from the bar graph. Find the number for each bar.
8 5 3 1 6 8
First, find the greatest number. The greatest number is 8.
Next, find the least number. The least number is 1.
Subtract the least number from the greatest number:
8 − 1 = 7
The range is 7.
let’s practice!